
Benchmark i7-7700, Ryzen5 3600, Ryzen7 3700X, i5-13500, Xeon E-2276G, part 1
Greetings, Wizards! Today we are benchmarking 5 servers, that are priced below 50EUR/month. How much power will we get? Which of them has the best value CPU-wise? How do they handle high load? Which of them is still worth to use in 2023/2024 for your WordPress or other PHP projects? – these are the questions, that I will try to answer.
In this first part of the benchmark I will look at physical servers – run all benchmarks on dedicated physical servers with no other tasks on them. Our benchmark will be, as usual, based on sysbench utility, WordPress plugin wpbenchmark.io and apache benchmark (ab).
But in the second part – I will create small virtual machine (using KVM) and run pretty much the same tests on (or inside or versus) those virtual machines (they will be 2 core and 4gb ram big). I think, that this kid of benchmark should show us difference of running VM on different hardware (that is similarly priced!). Also with virtual machine we kinda set same amount of CPU cores and RAM. I will run benchmarks under different conditions – while host server has no load, under medium load and under full overload.
Test server configuration

Even from the first sight it is hard to call these CPUs and servers very equal. The only relatively common parameters for them is price and amount of RAM.
- server with Intel i7-7700 is the oldest one and the cheapest. It has least amount of CPU cores, but it also costs 10eur per month less.
- intel i5-13500 is the latest CPU model here, holding much more CPU cores and threads, than its competitors, yes – it is still priced relatively the same.
- Xeon E-2276G – CPU from 2019 – almost 5 years old now – is the only server CPU here, as all others have been primary designed for desktop computers.
Sysbench CPU benchmark
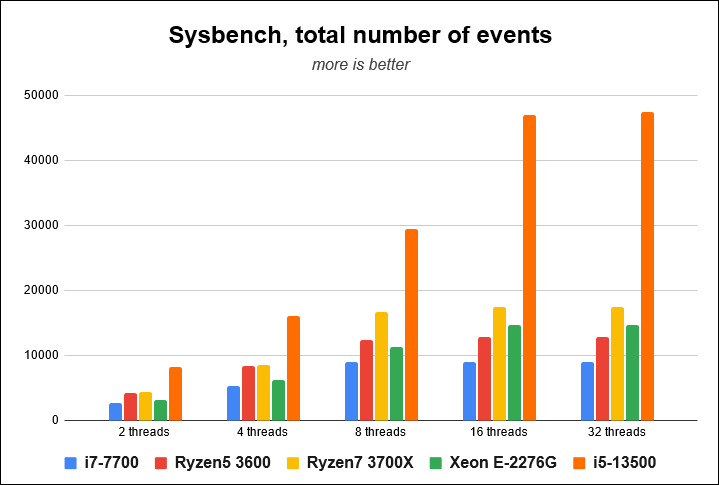
No need to say anything here – clear win of the technologically latest CPU with the higher number of CPU cores. Yes, I know, all those cores are not equal and I have see unpredictable performance degradation of server tasks with Intel’s 13th generation CPU, but compared to these older boys – at least this benchmark shouts a clear win.
Intel i7-7700 with the least number of CPU cores struggles to catch with other competitors.
WPBenchmark plugin
Setup for this is simple – Apache 2, PHP 8.2, MariaDB 10.5, Redis. I use apt for package installations. In these tests I have query cache disabled. PHP runs as FPM. No other tweaks done. Oh, and the OS is always latest Debian.
As I have always emphasized, CPU scores are the most important for WordPress. WordPress has so much logic, complex themes and plugins can alter and swap text back and forward, run multiple filters and that all has to be calculcated by CPU.
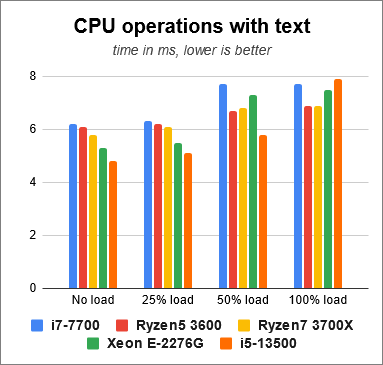
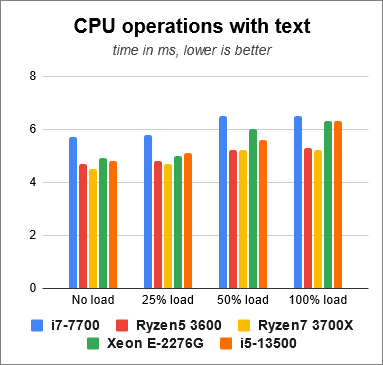
Benchmark execution time for all CPUs grow, but I would say, that for Intel it did not grow as proportionally, as for AMD. Especially latest i5-13500 – while being fastest under no load – becomes quite slow, when server’s CPU is stressed to maximum.
For adding CPU load I have used tool called stress.
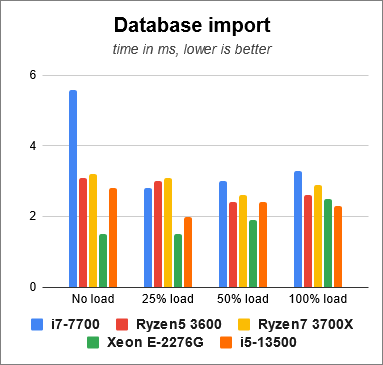
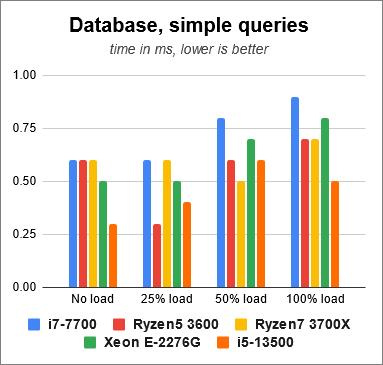
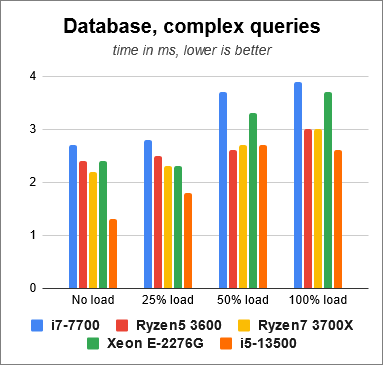
This set of benchmarks shows clear win of latest Intel chip. Also server with Xeon was performing quite well, especially, when server itself was not heavily overloaded. Old Intel i7-7700 was predicably the slowest, which again proves, that it does matter how old CPU is.
In the next graph I have combined all previous metrics. Lighter area indicates benchmark times without extra load and darker – with all the CPU threads being loaded with stress tool.
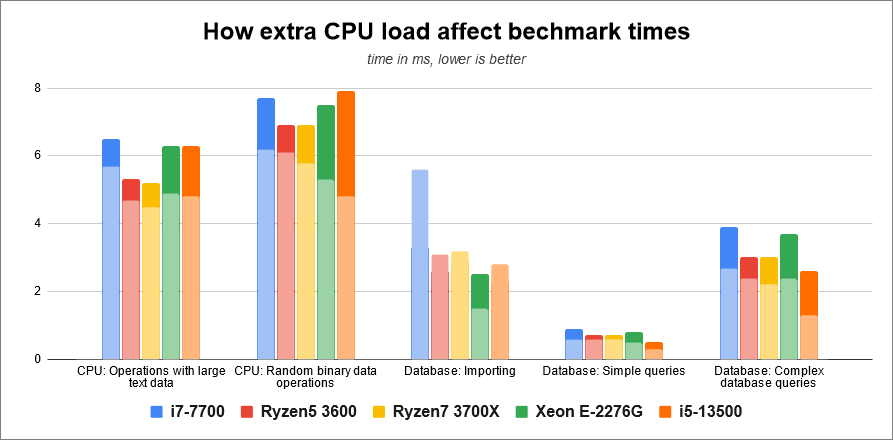
As you can see – most affected my external load was server with Intel i5-13500 and server with Xeon CPU.
Although – and this is my completely subjective feeling – I really liked how server with Xeon was performing. It was quite fast in all-around tasks and in general felt very and quite well responsive.
Apache Benchmark
As usual, I will use ab to simulate real visitor requests. My tests will include different concurrency, each of test has been executed for 5 minutes and we compare total number of handled requests.

Very interesting – in general server with Intel i5-13500 is the winner by the fact, that in all tests it has shown highest number of handled requests. This is mainly due to higher single-core performance and higher number of cores and threads.
But if you look at these graphs from the consistency point of view – I would say, that I like how AMD Ryzen7 3700X has performed and kept its average. Drop of performance for Intel, as we add more external load, is more steep, than for AMD.
In other words – if your server is more idling and now-and-then demanding tasks – Intel i5-13500 will complete them very fast. But if you are planning to have demanding background tasks running all the time and on top of that you would like to have good and reliable performance for other tasks (e.g. website requests) – then AMD Ryzen might actually provide you that a little bit better.
Conclusion
We have looked at 5 servers, that at specific provider cost less than 50eur per month. As expected – their performance was different. I will try to say some good words about each of them 🙂
- Intel i7-7700 – cheapest, yet still capable, although for smaller amount of tasks, than others.
- Ryzen5 3600 – OK server. Can handle more, than i7-7700. If that is the only option – it will still run good and fast.
- Ryzen7 3700X – powerful and quite capable server for large number of tasks.
- Xeon E-2276G – descent CPU, it felt very responsive, especially when switching between various tasks was needed. Long marathon runner, feels like it might be more stable due to its more server-like architecture.
- Intel i5-13500 – blazing fast, large number of cores can handle more, especially if number of concurrent tasks is less, than 50% of threads. Latest architecture provides best single-core performance! Massive amount of CPU power for low cost.
Your choice of a server should not be based only on CPU, that server has. Some servers in our tests are equipped with twice more storage, that can easily be a huge deal breaker. Always consider all aspects of the deal you are choosing.
Second part
In the second part of this review I will create virtual machines on each of these physical servers, give them equal amount of resources and see, how they will perform with similar tests. Continue to the second part of the benchmark.